Friday, October 30, 2015

Federal election results for Toronto and the GTA


[via CTV News]

In the Oct. 19 election, the Liberals won a majority government.  Every single seat in the city of Toronto went to the Liberals.  This is up from just five in the 2011 election, where the Liberals suffered a disastrous defeat and the NDP and Conservatives each won eight seats.  In this election, every Conservative and NDP MP went down to defeat.  The most high profile Tory MP to go down Finance Minister Joe Oliver in Eglinton-Lawrence.  The NDP, for the first time in over a decade, has no seats in Toronto.  NDP MPs Peggy Nash, Andrew Cash and Craig Scott, representing the ridings of Parkdale-High Park, Davenport and Toronto-Danforth, respectively, all received more than 40% of the vote but all came short of around 1,000 votes from winning.  And in the much watched-race in Spadina-Fort York, former MP and mayoral candidate Olivia Chow was easily defeated by Adam Vaughan. 

The popular vote in the City of Toronto was as follows:

Liberals  644,768  52.7%
Conservatives  331,728  27.1%
NDP  230,078  18.8%

The Liberal share of the vote was about the same in both inner and outer Toronto.  The NDP received about 1/3 of the vote in the former and the Tories about 1/3 in the latter, but nowhere were their votes sufficiently concentrated to win a seat.

Elections Canada has results for "major centers."  The Liberals again dominated the Greater Toronto Area, winning 46 of the area's 52 seats.  The Conservatives won the remaining six seats in the 905 region; the NDP was not a factor in this area.

The popular vote in the GTA was:

Liberals  1,318,120  49.9%
Conservatives  887,206  33.6%
NDP  359,418  13.6%

Quite the change from 2011!

Monday, October 12, 2015

What were the best polls for the Conservatives, NDP and Liberals in Toronto?

[source = http://canadianelectionatlas.blogspot.ca/]

As we're a week from the next federal election, here's an election-themed post.  In what polls (what Americans refer to as precincts) did the Conservatives, NDP and Liberals have their best showing?

The Conservatives polled best in more affluent, suburban districts.  Their best poll was #100 in the riding of Eglinton-Lawrence.

In this poll, located around Caribou Rd. east of Bathurst St. and south of Lawrence Ave., the Conservatives received a whopping 87.5% of the vote.  This poll is populated almost entirely by Orthodox Jews, and the Conservatives received nearly all the votes in this community.

The NDP's area of strength was in the city core, though the "orange wave" had spread outward to the working class suburbs of York-Weston and Scarborough.  The party' best poll, by far, was poll #181 in the riding of Trinity-Spadina, where the NDP received 84.5% of the vote.

This poll constitutes the Toronto Islands, an area known for its left-wing and environmental outlook.   Under redistribution that went into effect in this election, the riding of Trinity-Spadina was abolished and this poll went to the riding of Spadina-Fort York.

The Liberals, meanwhile, who in a stunning upset were reduced to third place, had less concentrated support (resulting in just 5 MPs being elected in Toronto, a long-time stronghold!), with clusters in certain affluent "uptown" districts, in parts of Scarborough and in the city's northwest.  The best poll for the Liberals was poll #13, located in the northwestern riding of York West, where the Liberals received 72.1% of the vote:

Not bad given that the Liberals received just 19% nationally.  This is a predominantly Italian area, and they voted very differently from their counterparts in Vaughan where the Conservatives won in a landslide.

So to sum up the best poll for each party was:

Conservatives  Eglinton-Lawrence #100 (Caribou Rd.)  87.5%
NDP  Trinity-Spadina  #181 (Toronto Islands) 84.5%
Liberals  York West  #13 (Rowntree Mills) 72.1%


Monday, September 28, 2015

Population growth in Metropolitan Toronto, 1921-1951


Population of city and suburbs, 1921-1951
                        
                                                   1921          1931          1941          1951

City of Toronto                          521,893      631,207     667,457     675,754
Suburban municipalities            89,550        187,141     242,471     441,716
Metropolitan Toronto total        611,443       818,348     909,928    1,117,470
% in city                                    85.4             77.1           73.3           60.5

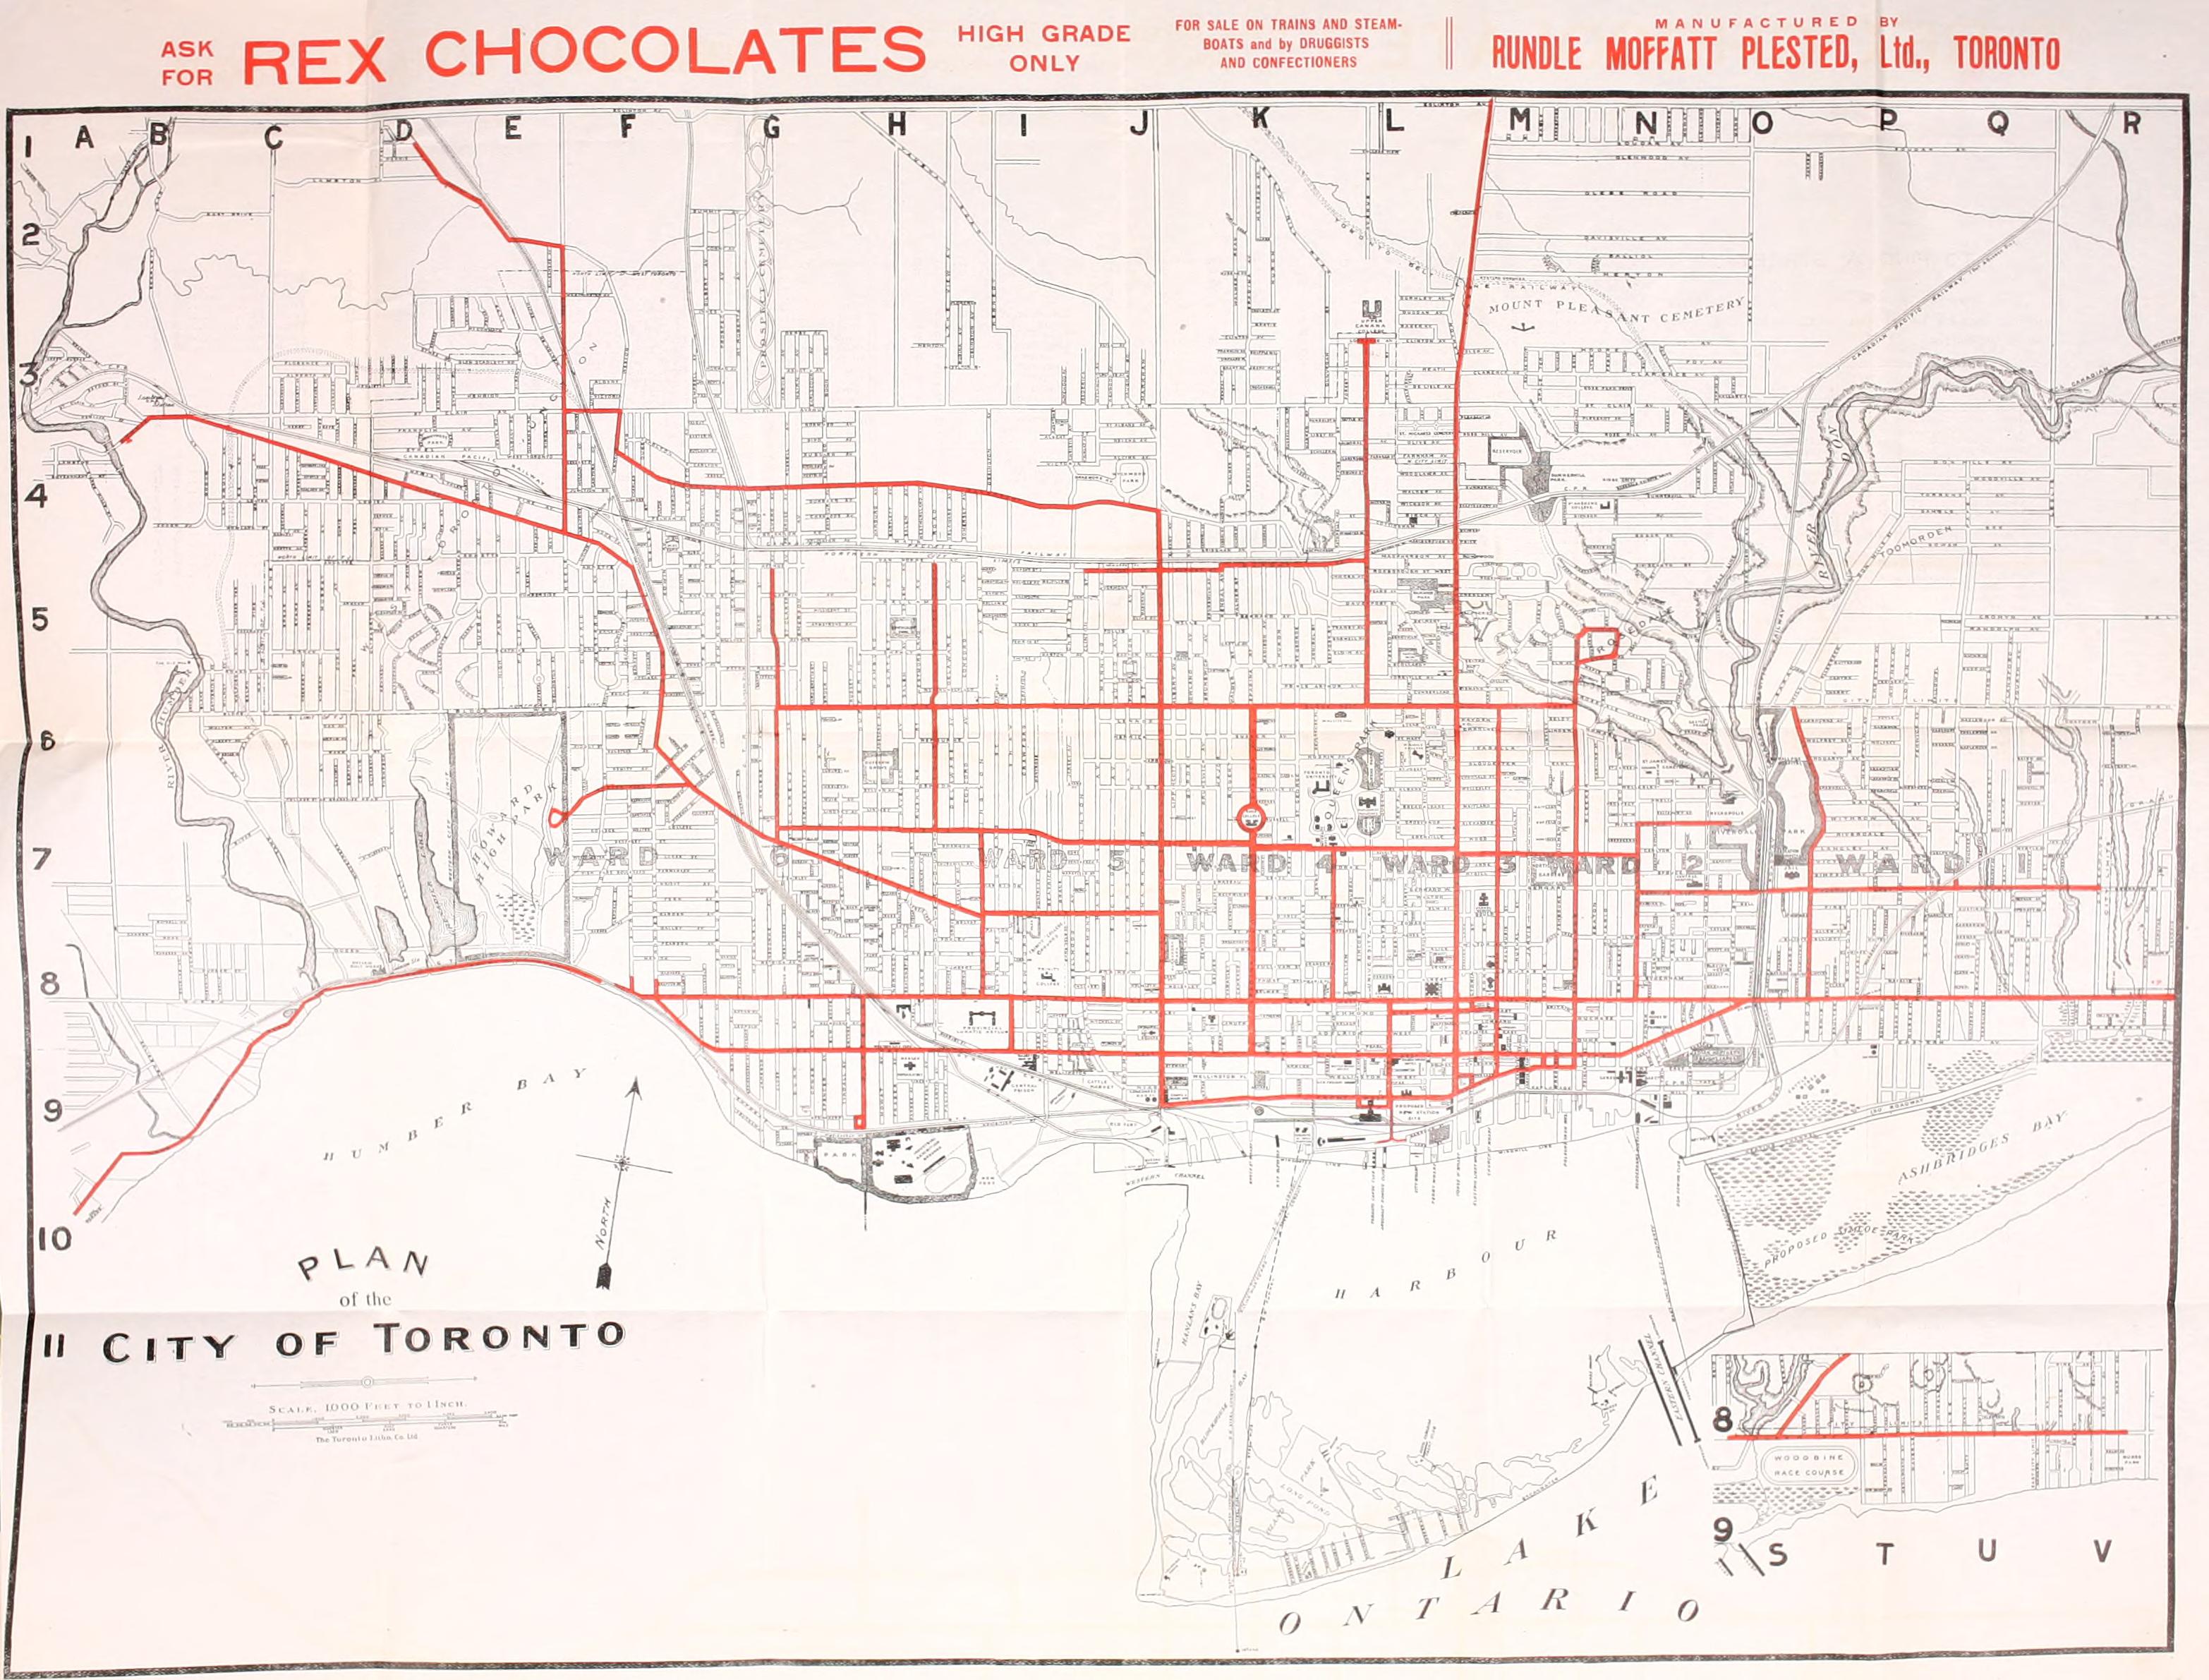
Toronto continued to annex suburbs until 1912, and by the 1920s, growth outside the city limits began to eclipse that in the city itself.  During this decade, the suburban municipalities doubled in population and raw population growth nearly matched that of the city (+97,000 and +109,000, respectively).  North Toronto, located north of St. Clair Ave. (wedged between Forest Hill and Leaside on the map) was mostly built up in the 1920s, as were remaining bits of the east end and the northwest fringe.  By 1930, the city of Toronto had been pretty much been all built up.

During the 1920s, a number of municipalities were incorporated, mostly out of York Township which surrounded the city to the north and west.  The rural northern section broke off and formed North York in 1922.  East York was out of the remaining eastern section in 1923 and the affluent suburbs of Forest Hill and Swansea were incorporated in 1924 and 1925, respectively.  In addition, Long Branch was incorporated out of a section of Etobicoke in 1930, next to the streetcar suburbs of Mimico and New Toronto that were incorporated in the 1910s.  By 1930, the 12 suburban municipalities that would become part of the Metropolitan Toronto federation in 1954 had been incorporated.

Population of suburban municipalities, 1931-1951:

                                                      1931         1941         1951
East York                                       36,080      41,021      64,616
Etobicoke                                       13,769      18,973      53,779
Forest Hill                                      5,207        11,757      15,305
Leaside                                           938           6,183        16,223
Long Branch                                  3,962        5,172         8,727
Mimico                                          6,800        8,070         11,342
New Toronto                                  7,146        9,504         11,194
North York                                    13,210      22,908        85,897
Scarborough                                  20,682      24,303        56,692
Swansea                                         5,031       6,988          8,072
Weston                                           4,723       5,740          8,677
York                                               69,593     81,052        101,582

In his book Unplanned Suburbs, Richard Harris notes that: "As late as 1931, the suburbs were clearly more blue-collar in character than the city, and a majority of suburbs were heavily dominated by blue collar settlement" (p. 50).  This included the large predominantly working class suburbs of York and East York, as well as the industrial satellites of Mimico and New Toronto.  During the 1910s and 1920s, these outlying suburbs attracted many working class immigrants from Britain, such as those in the skilled metal trades.  However, Harris notes that the composition of the suburbs changed in the 1930s and 1940s as they attracted more professionals, managers and white collar workers.  "By midcentury, the city was clearly more blue-collar (55 percent) than the suburbs (40 percent)."

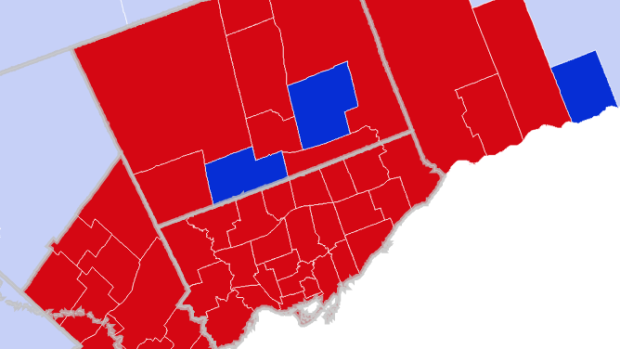
(This isn't to say that the working class ceased to exist in the suburban fringes of Toronto.  Indeed, York and East York townships were hit particularly hard by the depression.  Appeals for annexation by the City of Toronto were rebuffed, which opposed taking in the "the semi-circle of bankrupt municipalities on its borders."  In the 1940s, York Township became a stronghold for the socialist CCF.)

Indeed, this changing composition of the suburbs is evident by looking at the population changes during this period.  Growth in the working class suburbs had slowed by the 1930s, likely due to the severe drop in immigration during the depression.  In contrast, affluent Forest Hill tripled in population in the 1930s, and Leaside, which barely had any people in 1931, saw its population skyrocket.  In Etobicoke, growth was almost certainly concentrated in the affluent Kingsway area.   In the 1940s, the well-to-do led the way in the mass migration to the postwar suburbs of Etobicoke and North York.

In 1951, a majority of residents still lived in the city proper, but this would change dramatically a decade later.

Tuesday, September 15, 2015

Toronto's social geography in 1931

The previous post looked at the location of some of Toronto's ethnic communities on the eve of World War II.  In this post I will look at the social geography of Toronto around this time, drawing from the work of geographer Daniel Hiebert.

Hiebert shows a city divided on class and ethnic lines.  While Toronto is now largely characterized by an increasingly affluent and gentrified core with the poor increasingly living on the periphery, at this time Toronto more or less conformed to the Chicago School concentric ring model.  Hence, "the rate of home ownership and the size and quality of housing...all tended to increase with distance from the city centre" (p. 61).  The "inner city" between Dovercourt Rd. and the Don River south of Bloor had older, lower cost housing and was home to the majority of the city's eastern and southern European and Chinese residents.  Residents with origins in the British Isles showed a tendency to vacate the inner city and move to outlying districts.


The above map (p. 61) shows assessed housing values in 1931.  The poorest areas were all located south of College/Carlton St. (including Cabbagetown, the Ward and Kensington Market) while the most expensive housing was located in a large northern area (including the Annex, Rosedale and the Avenue Rd. "hill district") as well as on the western fringe near High Park.

Hiebert (p. 63) also includes the average assessed dwelling value for occupational groups.  For the city as a whole, the average dwelling was assessed at $2,304.  46.2% of householders owned their dwelling, which ranged from 78.9% for capitalists to 29.7% for unskilled workers.

Capitalists (1.9% of sample)  $6802
Professionals/managers (11%)  $4177
Self-employed (21.1%)  $2624
White collar workers (15.8%)  $2343
Skilled blue collar workers (35.2%)  $1744
Unskilled workers (15.1%)  $1202

Source:

Daniel Hiebert, The Social Geography of Toronto in 1931: A Study of Residential Differentiation and Social Structure, in Journal of Historical Geography 21, 1 (1995): 55-74

Thursday, September 10, 2015

Toronto's ethnic communites before WWII

Toronto did not receive numbers of European immigrants comparable to New York or Chicago in the early 20th century.  Nonetheless during this period Toronto saw increased immigration from the continent and the emergence of several ethnic enclaves.  Jews from eastern Europe represented the largest of these new immigrant groups; between 1901 and 1931, the Jewish population grew fifteenfold from 3,000 to 45,000 (7.2% of the population).  Italians were the second largest of these "new" immigrant communities.  Other European groups included Poles, Ukrainians, Finns, Greeks and Hungarians.  In addition, Toronto's first Chinatown emerged during this period and a trickle of West Indian immigrants added to Toronto's then-small black community.

Before World War I, an area near City Hall known as the Ward (bordered by Yonge St. and University Ave., College and Queen Sts.) was home to most of the city's Jews and Italians.  By the 1930s, however, most of the city's ethnic communities had moved to the west-central area of the city, in wards 4 and 5, between University Ave. and Dovercourt Rd. south of Bloor St. 


In a 1941 MA thesis Nadine Hooper ("Toronto: A Study in Urban Geography") mapped the residential concentrations of various ethnic groups in the city in 1939, based on samples from community directories.  This gives us the general picture of Toronto's ethnic map on the eve of World War II.  I share here her maps for the Jewish, Italian, Ukrainian and Chinese communities.


The bulk of the Jewish community lived in the Spadina-Bathurst-College area, which included Kensington Market (then commonly known as the Jewish Market).  They lived near the city's garment district which employed the Jewish working class.  Several better off Jews however had moved out of this core area, living on the Davenport hill overlooking the city and in the suburb of Forest Hill Village, where wealthy Jews began moving in the 1930s.  Hence the northward migration path along Bathurst, which had become a mass movement after 1945 as the Jewish community became more affluent, was established.


Italians were more spread out.  However Little Italy along College St. was already well established and the main residential concentration was located south of College between Bathurst and Dovercourt Rd.  Other Italians lived in the industrial northwest area, particularly near Dufferin St. and Davenport Rd.  This would serve as the impetus for the northwest movement of the Italian community in the postwar years.


Ukrainians, as well as Poles, were concentrated in the Bathurst-Queen area.  Many lived and worked in the Niagara St. industrial district south of Queen.  Both of these communities would follow Queen St. to the High Park area after WWII.


As Jews and Italians moved westward, the Ward became the city's Chinatown.  However the majority of the city's Chinese residents were scattered among the main retail arteries, living above laundries, restaurants and other businesses.  After the demolition of old Chinatown in the 1960s to build the new City Hall, the present day Chinatown developed in the formerly Jewish Spadina area.
'


Tuesday, September 8, 2015

Why the east end developed later than the west end

                                         [image of the Bloor Viaduct]

Basically...it was the Don River. 

The original Town of York (laid out in 1793) was located east of Jarvis St. and south of Queen St., in what is known as "Old Town" today.  However the westward bias of Toronto growth was soon underway.  Frederick Armstrong, in his book A City in the Making (1988, p. 17), notes that by the time the City of Toronto was incorporated in 1834, this area had "long ceased to be the centre of the city."  As Armstrong explains:

"The westward spread of York, which had left the original town so undeveloped, had come about because of several factors. Most obvious were the unhealthy swampy areas on the town's eastern margins around the outlets of the Don River, which was already known as Ashbridge's Bay. But there were also positive reasons for the spread of the town to the west. Old Fort York (then usually called the Garrison), situated on the western Military Reserve which extended west from Peter Street, exerted a pull which became stronger when the provincial legislative buildings were moved to the west end. Yonge Street, opened by Simcoe's Queen's Rangers in 1796, provided another reason for the shift westward. It became the main route north to Toronto's rich agricultural heartland, stretching up to Lake Simcoe and potentially beyond to Penetanguishene on Georgian Bay. Yet another factor in the town's westward expansion was the pleasant lakeshore running from the mouth of the Don River towards the Garrison. Paralleling this strand, Front Street, then edging the habour, rapidly became the preferred residential location of many of the most prominent citizens. Finally, as road conditions began to improve in the years immediately before incorporation, Queen (Lot) Street, which was then the road leading to Dundas Street and the west, began to exert a north-westerly pull away from the original town plot. Consequently, by 1834 the growth of the city had resulted in a fairly solidly built up area stretching along the east-west axis of King Street, from Simcoe's town to York Street. West of York Street, a series of semi-built up areas continued on to Peter Street and the Garrison."

The west end - running out to High Park - was already well established by 1914, with the exception of the far northwest fringe (i.e. the Junction) which continued to grow in the interwar years.  In contrast, the east end was much less developed and grew mostly in the interwar period.  The opening of the Prince Edward Viaduct (aka the Bloor Viaduct) in 1918 spurred development east of the Don.

The difference is evident in looking at photos from the City Archives.

Here is Bloor and Delaware in 1917 - this is 3.5 km or 2 miles from Yonge St. - already well established, has a streetcar line etc.:


Meanwhile, at Danforth and Pape in 1913 - the same distance east from Yonge St. - the roads aren't paved yet and it's barely developed:


This streetcar map from 1912 shows that the streetcar and road network is much less developed east of the Don:


Here are some population figures for areas annexed by the city in the late 1800s and early 1900s.  Note that the city stretched out to High Park by the 1880s, but the Beaches area was not annexed until 1908 and 1909.  Here's an annexation map from Wikipedia:


As census tract populations aren't available until 1941, I had to draw from a combination from wards and 1921 federal riding populations (the 1921 Census broke the ridings into wards and included population figures for 1901 and 1911) and they do not match up exactly with these boundaries.  For instance, what I call "Riverdale" is located south of the Danforth as far as Pape (although the Riverdale annexation stretched to Greenwood), "East Toronto" is everything south of the Danforth and east of Pape, and Parkdale and Brockton uses Dovercourt rather than Dufferin and the CPR tracks rather than Bloor as boundaries.  I also included the West Toronto Junction, which became Ward 7 when annexed by the city in 1909.  In addition, to these figures from the census, I tallied up the 1941 populations for these areas using census tracts.  So here are populations are for 1901, 1911, 1921 and 1941.

Riverdale  11,179; 24,387; 33,747; 44,297
East Toronto  4,633; 28,151; 66,204; 85,835
Parkdale and Brockton  27,549; 67,954; 91,186; 94,591  
The Junction  6,091; 18,860; 34,938; 44,908

Parkdale and Brockton then saw its great growth spurt between 1901 and 1911 and had flatlined by 1921, while East Toronto added the most to its population between 1911 and 1921, and continued to grow into the 1920s.  

West Toronto Junction, the city's northwest fringe, grew later than the area directly to the west of the core, and like the area east of the Don also added the most population between 1911 and 1921 and grew significantly up until 1941.  But it too developed a bit earlier.


* With special thanks to Tiger Master on the urbantoronto.ca discussion board, who made me aware of the archive pictures and the 1912 streetcar map.


Monday, September 7, 2015

Welcome!


Welcome to South of Bloor Street, a blog focused on the urban development, social history and demographics of Toronto.  I live in what was until the 2015 redistribution the federal/provincial riding of Trinity-Spadina, which includes such areas as the University of Toronto, the Annex, Kensington Market and Chinatown, Little Italy and Queen West. 

There will be much focus on this area of Toronto, but by no means will it be exclusive to it, and from time to time I will look at other cities as well.

I wanted to title this blog Trinity-Spadina, but it was already taken.  I have opted for South of Bloor Street as Bloor St. was historically an important north-south divide in the city (socioeconomic and ethnocultural) and even today diehard urbanists are said to never venture north of Bloor (though one could argue that Dupont or St. Clair represent that boundary today).